Macroeconomics Datas

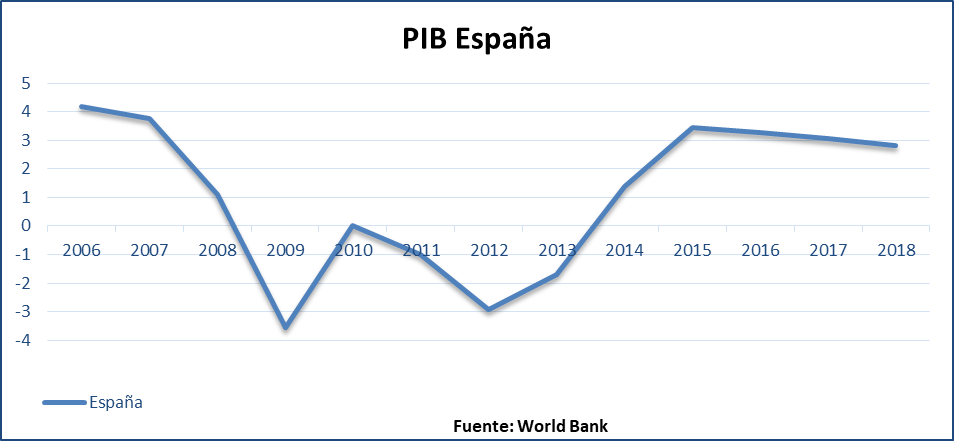
In the last two quarters of 2008, the Spanish GDP suffered a slight downgrade. The Spanish economy could cross a small pause and not increase the growth expectations that the various international organisms and financial institutions estimated. The following graphic shows the evolution of the Spanish GDP.

The three Autonomous Communities that we will evaluate are Andalusia, the Community of Madrid and the Valencian Community which show a growth trend of their GDP very similar to the growth of the Spanish GDP. As can be observed from the graphic, the Valencian Community is the one that was mostly affected by the crisis and whose growth was slowly and more constant.

Las tres Comunidades Autónomas que vamos a valorar son Andalucía, Comunidad de Madrid y Comunidad Valenciana que muestran un crecimiento de su PIB muy parecido al del crecimiento del PIB español.

Como se puede observar en la gráfica, la Comunidad Valenciana es la comunidad que más le afecto la crisis y cuyo crecimiento ha sido más tardío y constante.

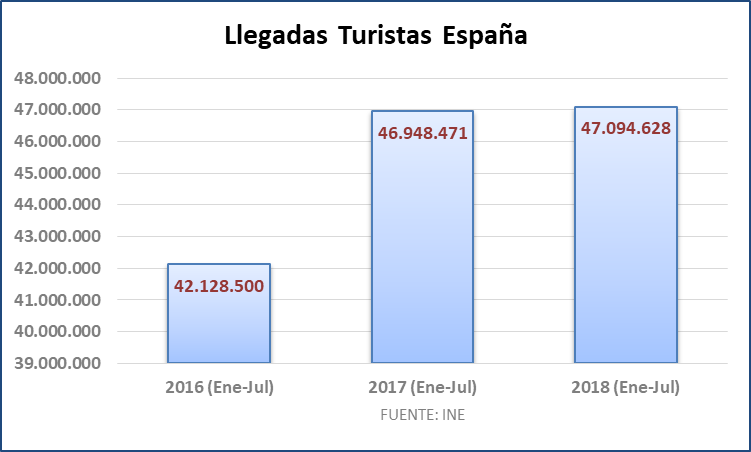
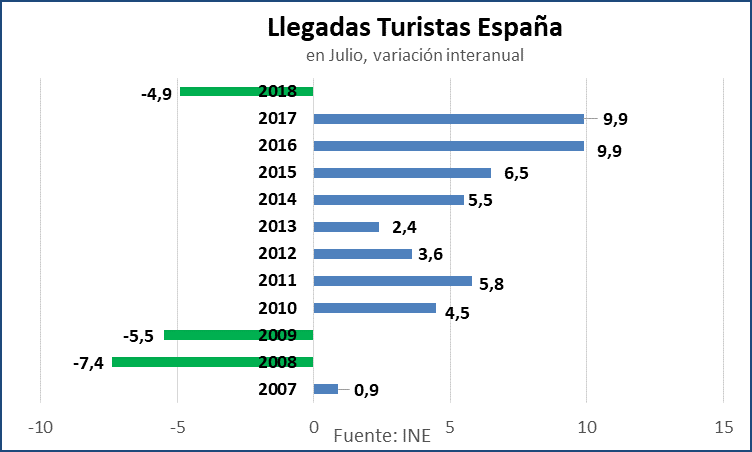
It is important to analyze the income of tourists in Spain as it recover the 68% of its Gross Domestic Product (GDP). As can be seen in the graphic ‘Number of tourists in Spain’ in the first six months of the year 2018 the number of tourists is higher than the first six months of the previous year. However, for the first time in the last ten years there has been a decline in the arrival of tourists in the two summer months just as the second graphic shows.The second chart shows how the month of July 2018 suffered a 4.9% decrease in the rate of tourists and, although there are no official data, everything indicates that in August there was a decrease in the tourist rate compared to the previous year.

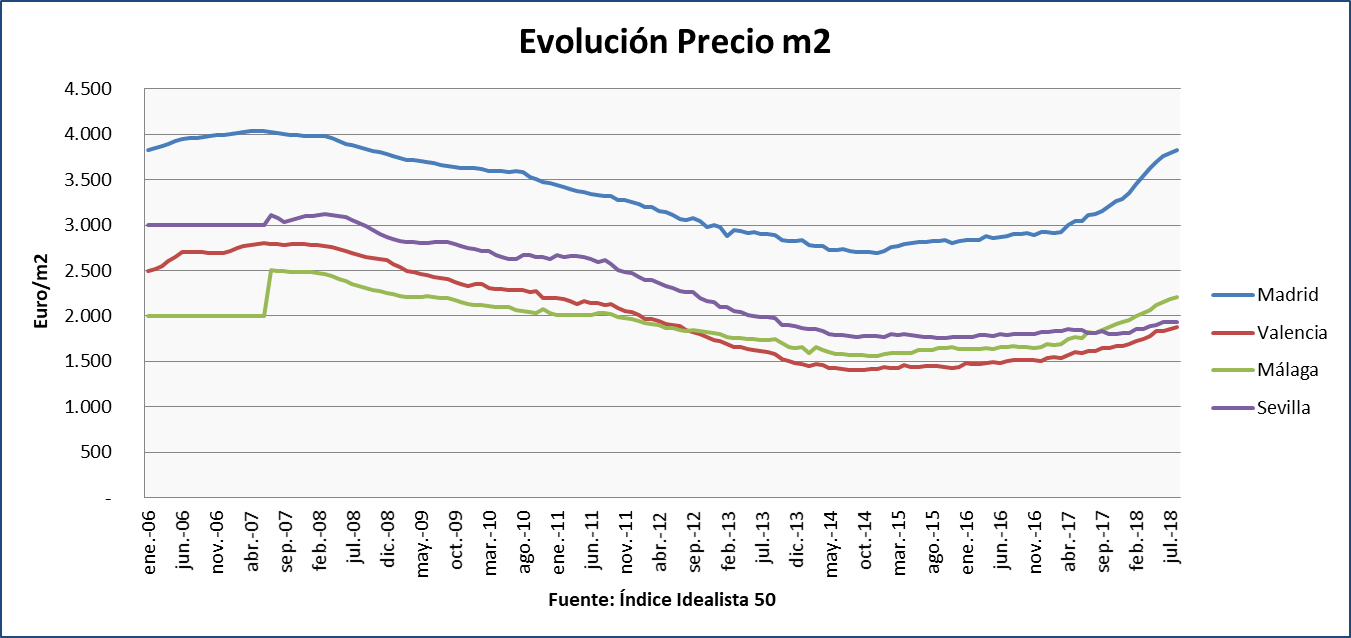
In the real estate sector, one of the most reliable sources to measure the evolution of the price of the square meter in the different Spanish cities is the web page www.idealista.com, which is the main real estate portal in Spain.According to its Idealist Index 50, it can be observed that the average square meter in the city of Madrid is at the same level as in 2006, the rest of the cities still have not reached the highest levels.The following chart shows the evolution of price per square meter in the main Spanish cities.